PostgreSQL vs MySQL: A Test Drive with Stroppy
Comparing databases is hard. There are plenty of well-established benchmarking suites out there, and plenty of people with more experience doing it. But at some point, if you need to understand how a database behaves under your workload on your hardware, you end up running the tests yourself. Vendor benchmarks, Stack Overflow threads, and even LLM-generated answers all have their limits — they can point you in a direction, but they can't replace your own measurements.
Stroppy is a tool we've been building to make that hands-on testing more practical. It's built on top of k6, the load testing framework, and focuses on database stress testing with parameterized SQL, data generation, and a pluggable driver model.
This post is a walkthrough of our first attempt at running Stroppy against two databases at once: PostgreSQL and MySQL, both with completely stock configurations, running a TPC-C-derived workload for 30 minutes per test. It's not a proper benchmark — more of a practice run to shake out the tooling. Along the way, we'll cover how we added MySQL support, why running 16 sequential tests by hand quickly becomes impractical, and what happens when your test VM runs out of disk space mid-run.
Adding MySQL to Stroppy
Stroppy uses a driver registry pattern. Each database driver implements a three-method Go interface:
type Driver interface {
    InsertValues(ctx context.Context, unit *stroppy.InsertDescriptor) (*stats.Query, error)
    RunQuery(ctx context.Context, sql string, args map[string]any) (*QueryResult, error)
    Teardown(ctx context.Context) error
}
Drivers self-register via Go's init() function — the dispatcher code never changes when you add a new database. Just implement, register, and add a blank import.
The original PostgreSQL driver was written directly against pgx, which is idiomatic but means every new driver had to reimplement parameter conversion, row scanning, and connection lifecycle from scratch. For MySQL, we took a different approach: we extracted a shared sqldriver package that handles the common parts of any database/sql-compatible driver.
The key abstraction is the Dialect interface:
type Dialect interface {
    Placeholder(index int) string           // "$1" for Postgres, "?" for MySQL
    ValueToAny(v *stroppy.Value) (any, error) // type conversion per driver
}
With this in place, the MySQL driver itself is compact. The dialect maps Stroppy's protobuf values to Go types MySQL understands, and the shared package handles query building, parameter substitution (:param → ?), bulk inserts, and connection management. The actual MySQL-specific code is one driver.go (connection setup, pool config) and one dialect.go (placeholder format, type conversions). Everything else — RunQuery, InsertValues, row scanning, teardown — is shared.
If your database has a database/sql driver (and most do), adding it to Stroppy follows the same pattern: implement a Dialect, wire up the constructor, register it. The Extensibility guide has the full walkthrough.
The Test Matrix
We ran TPC-C pick workloads — random order selection queries hitting the warehouse, district, customer, stock, order_line, and new_order tables. Both databases were completely stock: default configs, no tuning, just a role and pg_hba.conf / bind address to allow connections.
Machine: 8 cores, 8 GB RAM, 279 GB SSD. Stroppy and the database ran on the same VM — not how you'd set things up in production, but it kept the setup simple and let us focus on the tooling.
Parameters varied across three dimensions:
| Parameter | Values |
|---|---|
| Scale (TPC-C warehouses) | 20, 200, 1000 |
| Virtual Users (k6 VUs) | 10, 50, 100 |
| Connection Pool | vus/2, vus, 2×vus |
Each combination ran for 30 minutes against both PostgreSQL and MySQL. That's 8 variants × 2 databases = 16 tests per run, roughly 8–12 hours wall clock depending on data loading time.
We ran the full suite twice.
Why We Built a Test Matrix Tool
Running 16 sequential 30-minute tests sounds simple. It isn't. You need to:
- Babysit the terminal for hours, starting each test when the previous one finishes.
- Log everything. With 16 tests and two databases, losing track of which parameters produced which results is inevitable without automation.
- Manage data efficiently. At scale=1000, loading TPC-C data into MySQL takes over 90 minutes. If you need the same dataset for multiple connection-pool variants, you don't want to reload it every time.
- Handle cleanup. Databases accumulate WAL segments, binary logs, temporary files. On a 279 GB disk running 12-hour test sessions, that matters.
This is why we wrote naggy — a Go program that reads a test matrix (currently defined in a Go config file), iterates over every database × variant combination, and handles the lifecycle:
- Create or restore the database at the required scale (using
pg_dump/pg_restorefor Postgres,mydumper/myloaderfor MySQL). - Launch stroppy with the right parameters.
- Collect the JSON summary into a named file (
003_pg_s20_v100_c100.json). - Tear down or preserve the database for the next variant.
The Ratio type in naggy's config expresses connection pool size relative to VUs:
Matrix = []Variant{
    {VUs: 10,  Scale: 20,   Conns: Ratio{1, 1}},   // conns = vus
    {VUs: 100, Scale: 20,   Conns: Ratio{1, 2}},   // conns = vus/2
    {VUs: 100, Scale: 20,   Conns: Ratio{2, 1}},   // conns = 2*vus
    {VUs: 50,  Scale: 1000, Conns: Ratio{1, 1}},   // conns = vus
    // ...
}
Naggy is still rough. The config is a .go file, it shells out to psql/mysql for DDL, and it doesn't manage disk space. We'll come back to what it needs in a moment.
Results
These numbers compare stock, untuned PostgreSQL and MySQL on a shared VM (database and load generator on the same box). This is not representative performance testing. Treat it as a demonstration of the methodology and tooling, not as grounds for choosing one database over the other.
Throughput
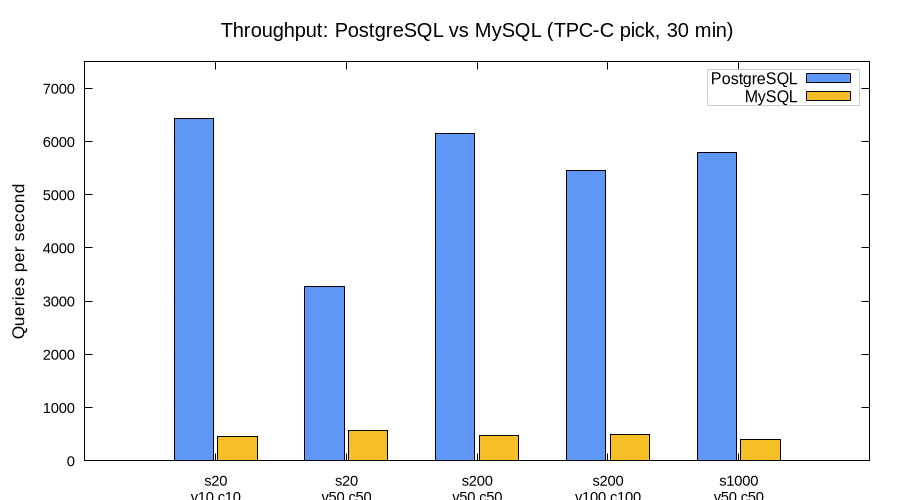
On stock configs, PostgreSQL showed 7–14× higher QPS than MySQL across all configurations we tested. At scale=20 with 10 VUs, PostgreSQL sustained 6,400 queries/sec vs MySQL's 460. These numbers say more about default configurations than about the engines themselves — a tuned MySQL would likely close much of this gap.
| Scenario | PG QPS | MySQL QPS | Ratio |
|---|---|---|---|
| s20, 10 VUs, 10 conns | 6,422 | 463 | 13.9× |
| s20, 50 VUs, 50 conns | 3,271 | 563 | 5.8× |
| s200, 50 VUs, 50 conns | 6,141 | 474 | 13.0× |
| s200, 100 VUs, 100 conns | 5,449 | 487 | 11.2× |
| s1000, 50 VUs, 50 conns | 5,788 | 397 | 14.6× |
A few things stand out. PostgreSQL improved as scale grew — s200 and s1000 with 50 VUs were faster than s20 with 50 VUs. The likely explanation is reduced lock contention: more warehouses means more data to spread queries across. MySQL, by contrast, got slightly slower at higher scales.
Latency
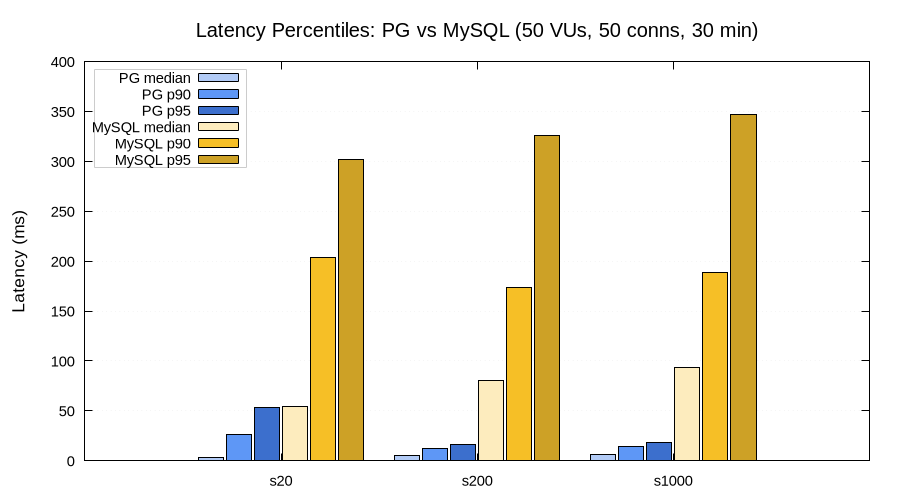
At 50 VUs with 50 connections, PostgreSQL median latency stayed between 3–6 ms regardless of scale. MySQL median was 54–93 ms — an order of magnitude higher. The P95 gap is even wider: PostgreSQL at 16–53 ms vs MySQL at 302–347 ms.
| Scale | PG median | PG P95 | MySQL median | MySQL P95 |
|---|---|---|---|---|
| 20 | 3 ms | 53 ms | 54 ms | 302 ms |
| 200 | 5 ms | 16 ms | 80 ms | 326 ms |
| 1000 | 6 ms | 18 ms | 93 ms | 347 ms |
Again — this is stock-vs-stock on a small VM. MySQL with InnoDB tuning, buffer pool sizing, and proper innodb_flush_log_at_trx_commit settings would likely tell a very different story. The takeaway here is less about the specific numbers and more about how straightforward it is to collect them with Stroppy and compare across configurations.
Connection Pool Size vs Performance
We tested three pool-to-VU ratios at scale=20 with 100 VUs: half as many connections as VUs (vus/2 = 50), equal (vus = 100), and double (2×vus = 200).
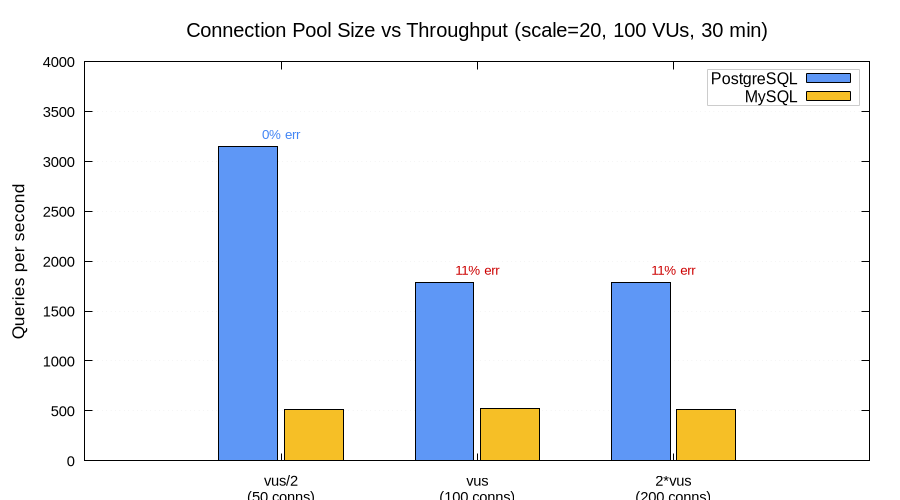
PostgreSQL with fewer connections was faster. At 50 connections (vus/2), PG delivered 3,145 QPS with zero errors. At 100 and 200 connections, throughput dropped to 1,783 QPS with an 11% error rate.
The cause: PostgreSQL's default max_connections is 100. When the pool tries to open 100 or 200 connections, it saturates the server. Excess connections get rejected with remaining connection slots are reserved for roles with the SUPERUSER attribute. With 50 connections, k6's virtual users queue for an available connection instead of all trying to connect simultaneously — and the database spends its time executing queries rather than rejecting them.
This generated millions of error log lines per test. In a 30-minute run with 100 VUs and 100 connections, PostgreSQL logged roughly 2.8 million connection-rejected errors. That's about 1,500 errors per second, each producing multiple log lines. This alone accounted for 99.7% of all log output across the entire test session.
MySQL showed the opposite pattern — connection pool size barely mattered. Throughput stayed flat at ~515–523 QPS regardless of whether the pool had 50, 100, or 200 connections. The bottleneck was elsewhere (likely InnoDB internals, or the query patterns themselves).
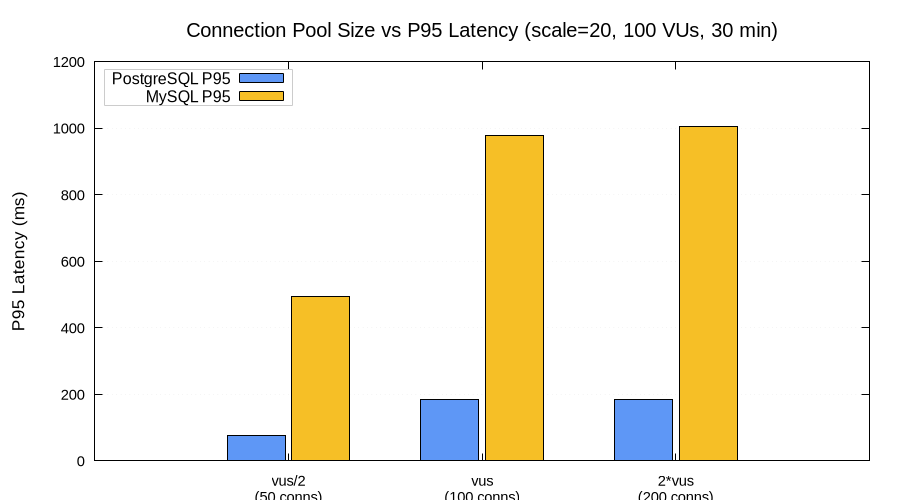
However, MySQL's P95 latency doubled when moving from 50 to 100+ connections — from 493 ms to ~1,000 ms. More connections didn't help throughput but added latency variance — likely the extra connections sitting idle most of the time, adding overhead without contributing useful work.
None of this is particularly novel — the max_connections limit is well-documented, and connection pooling is a solved problem in production. But it's a good example of why running your own tests matters: the interaction between pool size, VU count, and database defaults is specific to each setup, and it's easy to get it wrong if you only rely on general advice.
When the Disk Fills Up
We ran the full test suite twice on the same VM. The first run completed all 16 tests without issues. The second run didn't.
At test 008 (PostgreSQL, scale=1000), the database crashed:
PANIC: could not write to file "pg_wal/xlogtemp.3694402":
       No space left on device
PostgreSQL's WAL (Write-Ahead Log) had filled the disk. The database went into crash recovery, spent a few minutes in "not yet accepting connections" state, and produced about 23,000 error lines. The test result was lost — no JSON summary was written.
Later, when naggy tried to prepare MySQL at scale=200 and scale=1000, mydumper failed with the same "No space left on device" error. MySQL's LOAD DATA also hit Error 1114: The table 'customer' is full. Three more tests were skipped.
Final score: Run 1: 16/16 tests. Run 2: 12/16 tests (1 crashed, 3 skipped).
This is where naggy needs to get smarter. A tool running multi-hour test sessions on a shared disk should:
- Monitor available disk space before each test and skip or warn if headroom is insufficient.
- Clean up between tests — purge MySQL binary logs, rotate PostgreSQL WAL, remove stale dump files.
- For collocated testing (DB on the same machine), consider managing a dedicated database instance in a temporary directory with controlled storage budgets.
We also learned that at TPC-C scale=1000, the stock table alone has 100 million rows, and a mydumper snapshot of the full database is roughly 60–64 GB. On a 279 GB disk shared between two database engines, their data directories, WAL/binlog, dump files, and the OS — space runs out fast.
Reproducibility: Testing1 vs Testing2
The tests that completed in both runs produced consistent results — within 2–5% of each other for throughput and latency. This is a good sign: it means the test methodology is reasonably stable and the numbers are reproducible across runs on the same hardware.
| Scenario | Run 1 QPS | Run 2 QPS | Delta |
|---|---|---|---|
| PG s20, v10/c10 | 6,422 | 6,290 | -2.1% |
| PG s20, v100/c50 | 3,145 | 3,328 | +5.8% |
| PG s200, v100/c100 | 5,449 | 5,451 | +0.04% |
| MySQL s20, v10/c10 | 463 | 382 | -17.6% |
| MySQL s20, v50/c50 | 563 | 507 | -9.9% |
| MySQL s20, v100/c100 | 523 | 516 | -1.3% |
PostgreSQL numbers are very stable. MySQL shows more variance — the s20/v10/c10 test differed by 17.6% between runs, possibly due to background processes, InnoDB buffer pool warmup differences, or the fact that the second run occurred on a disk that was more fragmented and closer to full.
What's Next
This was a practice run, not a database shootout. Both engines were completely untuned, running on a small shared VM. The goal was to test the workflow end-to-end: write a test script, define a matrix, let the tooling run overnight, look at the results in the morning.
For Stroppy, we need a proper one-shot SQL execution mode — a way to run a single statement (like CREATE DATABASE or ALTER SYSTEM) without k6's VU/iteration machinery. Right now naggy shells out to psql and mysql CLI tools for DDL, which defeats the purpose of having a unified testing tool.
For naggy, the roadmap is longer:
- Move the test matrix out of Go source into a config format (JSON, TOML, or even TypeScript — same language as k6/Stroppy test scripts).
- Aggressive disk management: clean binary logs, manage WAL retention, monitor free space, abort early if storage is insufficient.
- Database tuning presets: at minimum, set
max_connections, buffer pool sizes, and flush strategies to known-good baselines before testing. - Full lifecycle ownership: spin up a dedicated database instance in a temp directory, manage its configuration, and tear it down after the run. No reliance on system-installed services.
The MySQL driver and the shared sqldriver package are in the Stroppy repository. Naggy lives in its own repo. If you want to add your own database, the Extensibility guide shows how — it's a Dialect implementation and a constructor. Pull requests welcome.